CO2 emissions from satellite data: a verifiable alternative to national reporting
International CO2 monitoring rests on national reports that are derived from industry statistics and not produced uniformly. We developed an alternative approach that quantifies emissions from satellite measurements – objectively verifiable and independent of the reporting body. The results largely matched the European reports and deviated markedly for individual states.
The situation
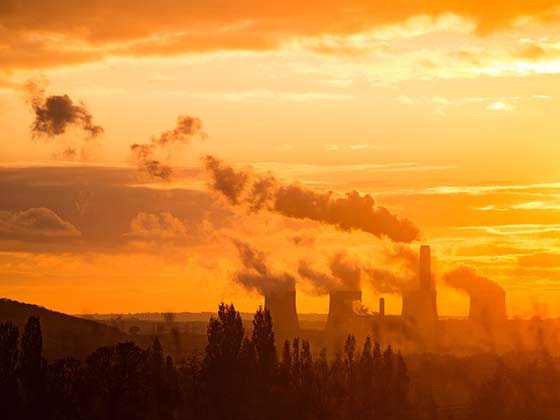
In the negotiations on global climate change, monitoring and reporting of CO2 emissions are the foundation of every commitment. The existing system rests on national reports that are based on industry statistics and not produced to a common standard.
The reliability of the number therefore hangs on the body that reports it – and that body is at the same time the one whose target achievement is measured by it. An independent, physically measured counterpart is thus not a methodological refinement but a precondition for verifiability.
The data
The core of the analysis is CO2 surface concentrations from the GOSAT satellite for Europe and Asia.
They were supplemented by NASA satellite measurements: vegetation indices, population density, carbon monoxide and nitrogen dioxide. These supplementary variables are not an add-on – they are the way to infer a source from a measured concentration.
Challenges
High dimensionality in space and time. An analysis across two continents and several years produces a data volume that becomes a computational bottleneck before it becomes a modelling problem.
Prediction at low data density. Satellite measurements of CO2 concentration are patchy in space and time – clouds, orbital paths, measurement conditions. What was needed was a model framework that allows spatio-temporal predictions even where no measurement exists.
Separating sources from sinks. The measured concentration is a net value. To derive emissions from it, human sources have to be separated from the effects of vegetation – which absorbs or releases carbon depending on the season. That is the core of the task: without this separation, a concentration is not an emission.
Including the complete carbon cycle. That includes the seasonal fluctuations of vegetation. A model that ignores them reads summer as a drop in emissions.
Approach
The basis is a spatio-temporal statistical model that connects the concentration measurements with the supplementary variables: vegetation indices for the biological share, population density for the distribution of human activity, carbon monoxide and nitrogen dioxide as co-emitted gases of combustion processes.
The methodological core is reconstructing a full-coverage picture of the sources from a patchy net signal – and stating the uncertainty instead of hiding it in a point estimate.
Outcome
The result is an alternative approach to the existing monitoring and reporting system for CO2 emissions.
The results largely matched the European reports to the UNFCCC. For individual states – China and North Korea – there were marked deviations that point to errors in the reporting system.
That combination is the real result: a method that confirms where independent scrutiny is to be expected, and deviates where it is absent, is usable as an audit instrument. A method that deviated everywhere would just be another model.
Transferability
Deriving a full-coverage, verifiable figure from patchy remote sensing data and setting it against a reported number – this pattern holds in every field where reporting stands in for measuring: land use and deforestation, methane sources, water abstraction, emissions of individual facilities. The methodological requirement is the same everywhere: separate sources from natural effects and state the uncertainty. The link to our agricultural work is close: in the environmental assessment tool for crop protection products, the task was the same – calculating a publicly cited figure so that it withstands scrutiny by third parties.
Today
This use case is the only one in our geo portfolio where the data foundation has changed completely. GOSAT was one of the few sources at the time of the project; today OCO-2 and OCO-3 deliver denser CO2 measurements, Sentinel-5P measures co-emitted gases at high resolution, and for methane there are satellites that resolve individual facilities. The question has thereby shifted from a country to a facility. Methodologically, we would today combine spatio-temporal statistics with learned components: the physical structure stays in the model, the relationships that are hard to parameterise are learned. And the computational bottleneck that limited the analysis back then is no longer one, thanks to cloud-native data formats and distributed processing. What has not changed, and what forms the core of the task: the separation of source and sink. It remains the point on which an emissions estimate stands or falls – no matter how well the measuring is done.
Last updated: 6 August 2026