Detecting trucks in orthophotos and telling vehicle types apart: over 99% detection rate
Finding a vehicle on an aerial image is one thing – recognising whether it is a single truck, a semitrailer truck or a multitrailer is another. We trained a model that does both: over 99% of the trucks are detected, and fewer than 10% of the detected vehicles end up in the wrong class.
The situation
Where freight vehicles are parked, and in what composition, is a foundation for transport, land-use and logistics planning: utilisation of rest areas, parking demand, traffic volumes at commercial sites. Traffic counts deliver point values at measuring stations, not a picture of the area.
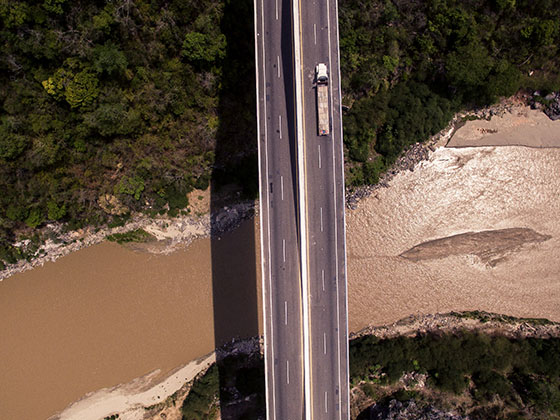
Aerial images deliver the area. But they contain only geometry – the distinction by vehicle type has to be derived from shape, and the boundary between the types is length.
The data
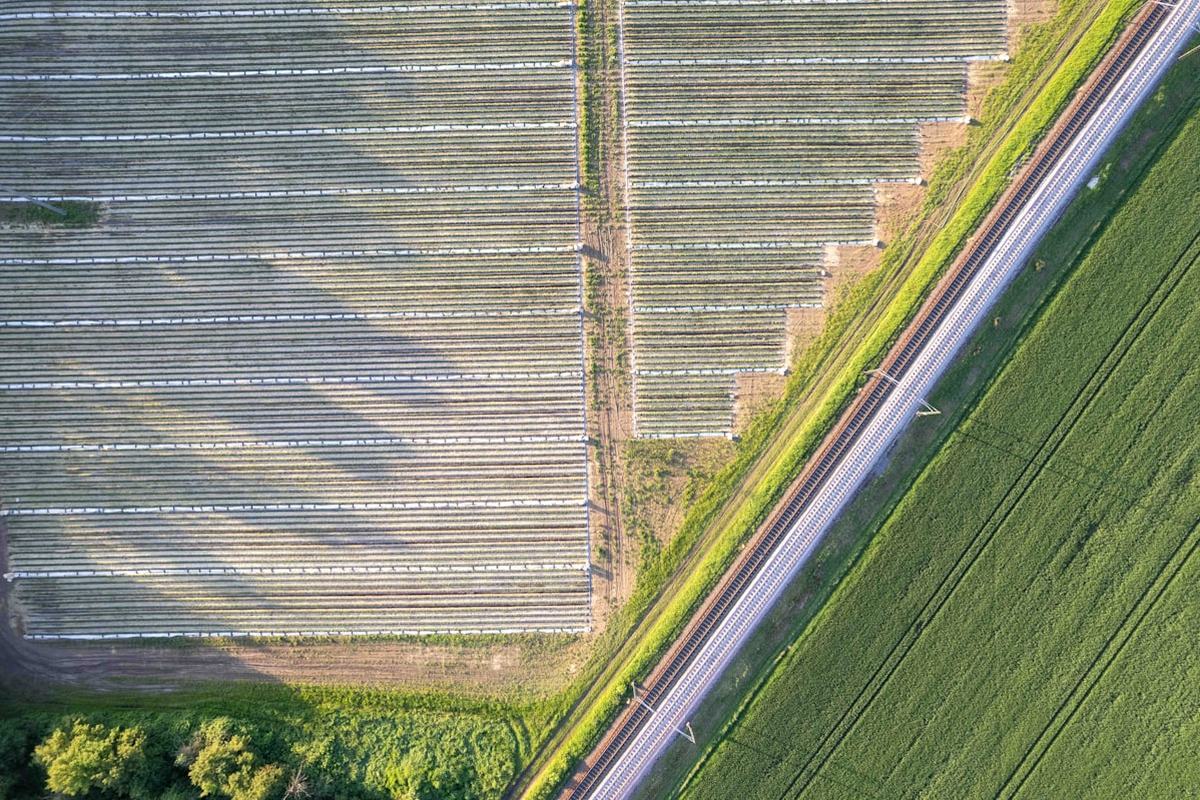
Digital orthophotos of North Rhine-Westphalia from OpenGeodata.NRW: four-band images with red, green, blue and infrared, 10 cm resolution, each tile covering one square kilometre, split into 100 × 100 metre patches for labelling.
From 2,400 selected patches, 2,148 were labelled and used for training and validation.
Challenges
The class boundary is simply a length. Single truck, semitrailer truck and multitrailer differ not in colour or texture but in length, and in whether tractor and trailer are separate units. A pure classification model cannot deliver that – the decision needs geometry.
What looks like a truck. The model occasionally detected cars with trailers, and in rare cases house walls, as trucks. Both are explainable: a car-trailer rig has the same silhouette, a house wall the same long straight edge. Such confusions are why a raw detection rate says nothing without looking at the errors.
Vehicles that touch. At rest areas and depots, trucks stand close together. Where two vehicles border each other, the separation is a decision the model has to make before anything can be counted.
Limited training data. With a good 2,000 labelled patches, the data basis is tight for a task with three classes and rare types – multitrailers are far rarer on German roads than semitrailers.
Approach
Segmentation instead of object detection. The basis is a pretrained TernausNet-16, fine-tuned on the orthophotos. The model classifies every single pixel – as background, trailer or cabin.
Classification follows from geometry. Only the combination of cabin and trailer and their extent yields the assignment to single truck, semitrailer truck or multitrailer. That makes the class decision traceable and correctable – unlike a model that predicts the class directly.
Analysis in ArcGIS Pro. The trained model was integrated into ArcGIS Pro through an inference function and an Esri model definition file – annotation and spatial analysis thereby sit in the same environment.
Outcome
Over 99% of the trucks were detected, under 10% of the detections assigned to the wrong class.
The second number is the more informative one. Detecting is the easier part; determining the vehicle type from a vertical aerial image is the real achievement – and openly stating the error rate is what makes the result usable for a planning decision in the first place.
Transferability
Decomposing a class decision into sub-objects and geometry – cabin plus trailer plus length yields vehicle type – is the transferable core. It applies to every task where the class hangs not on appearance but on structure and dimensions: building types, equipment types on industrial sites, ship classes in ports, agricultural machinery. We used the same data source for the detection of photovoltaic modules.
Today
We would do two things differently. First, the data volume: the bottleneck was annotation, and for that there are now promptable segmentation models that deliver vehicle outlines without class-specific training – the manual work shifts from drawing to reviewing. Second, the error analysis: today we would not report confusions with car-trailer rigs and house walls as residual error, but deliberately feed them into training as hard negative examples. What has changed about the setting: official orthophotos are published more frequently and at higher resolution. A snapshot can thereby become a time series – and the question of how a rest area is used across the year is worth more than a count on a single day.
Last updated: 6 August 2026