Mapping photovoltaic modules from orthophotos: 47,818 images, one shapefile for all of NRW
Nobody fully knows where photovoltaics are already installed – systems spring up in a decentralised way, on rooftops, in large numbers. We trained a neural network that detects PV modules on open orthophotos and produced a geodataset showing location and shape of the systems in North Rhine-Westphalia.
The situation
For planning grid expansion, storage needs and funding programmes, the existing stock is the foundation. With photovoltaics, that stock is scattered: many small systems, many owners, reporting channels that do not capture everything. An information gap opens up about where renewable generation is actually already installed.
This gap can be closed without collecting new data. The systems are visible on aerial imagery – they only have to be found, across the whole area and repeatably.
The data
Digital orthophotos from the OpenGeoData portal of the state of North Rhine-Westphalia: 47,818 images with four spectral bands, 0.1 metre spatial resolution, in the reference system EPSG 25832.
What is remarkable is the source: this is open government data. The analysis required no aerial survey and no data purchase – only the ability to handle this volume of data.
Challenges
The modules do not look alike. PV modules differ considerably in their colour properties – by design, age and soiling. A model trained on one appearance overlooks the others.
Very small areas with few features. A module occupies a small area in the orthophoto with little internal structure. There is little for a model to hold on to – which is why the smallest systems stayed outside the detection.
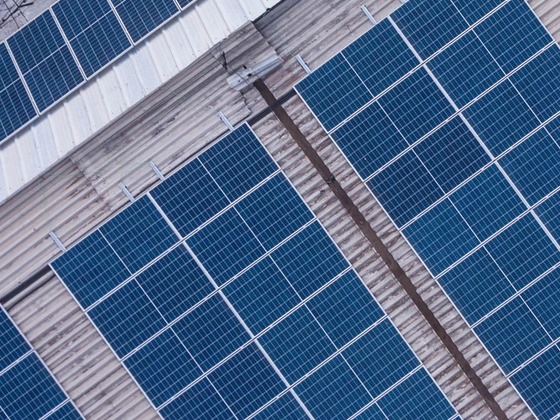
Roof pitch distorts the appearance. Modules sit on sloped roofs. In a vertically captured orthophoto they appear foreshortened and distorted, and differently so per roof. The same system looks different on two roofs.
Approach
Annotation in ArcGIS, training in TensorFlow. The training data was labelled in ArcGIS and exported to the TensorFlow Object Detection API. The advantage: the annotation stays georeferenced, and training runs in the environment where the models are at home.
Instance segmentation with Mask R-CNN. The method delivers not just a box around each detected module but a mask – the actual area. That is the decisive difference for this task: a box says that there is a system, a mask says how big it is. Only that makes it possible to talk about area and capacity later.
Output as a geodataset. The result is a shapefile with location and shape of the modules – usable in any GIS, ready to intersect with grid, building and cadastral data.
Outcome
The result is a shapefile showing location and shape of the PV modules in North Rhine-Westphalia. Because the analysis builds on open state data, it is repeatable: with the next survey release, the same workflow can be applied again – turning a snapshot into a continuously updated record.
Transferability
Object detection on official orthophotos carries beyond photovoltaics, and with the same data source: on the same NRW orthophotos we detected trucks and classified them by vehicle type. Equally possible are roof areas and their suitability, soil sealing, water bodies, tree cover, warehouses and silos. Whoever masters the source can capture any object class on it – that is the real value of this project.
Today
The task has become easier and the bar higher. Easier, because pretrained foundation models for remote sensing data can be adapted to a new object class with far fewer annotated examples, and because promptable segmentation models deliver usable masks without class-specific training. For processing we would hold the images as Cloud-Optimized GeoTIFF with a STAC catalogue instead of nearly 48,000 individual files – which is the difference between a federal state and a country. Higher, because the interesting step today is not the detection but what comes after: deriving a capacity estimate from module area, roof pitch and orientation, and reconciling the mapped stock against the German installations register (Marktstammdatenregister). A map thereby becomes a statement about generation.
Last updated: 6 August 2026