Automated and user-friendly Data Analysis Pipeline for Agricultural Field Trials

a Supper & Supper Use Case

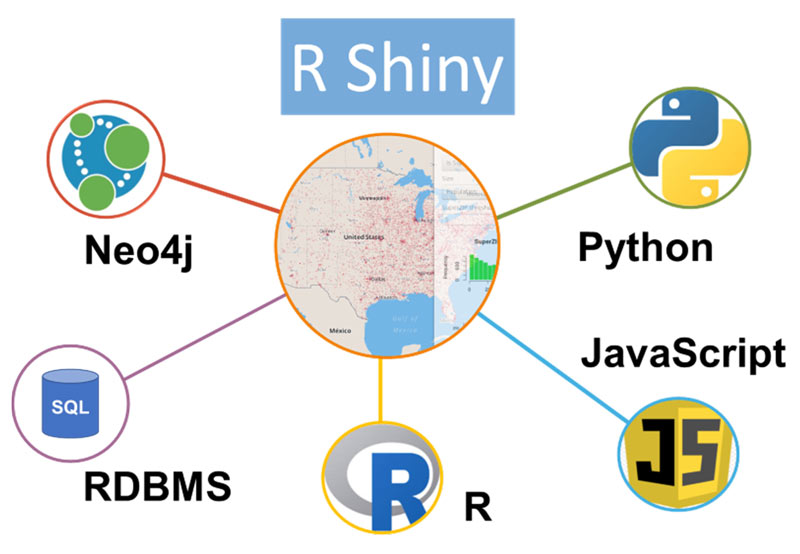
The goal of this project was to develop a tool incorporating an all-in-one automatic pipeline for agricultural data analysis, that integrates different database systems, visualization tools, training of machine learning models and statistical inference. The tool enables people from a non-technical background to initialize new analyses and help them to make business decisions easily.

The major challenge was to combine the diverse set of data processing tools. The realization required broad knowledge of data storage, data extraction, data loading and data analysis techniques. The second challenge was the interface design. The tool was designed primarily for non-tech users. Therefore the tool needed to be well documented and required an intuitive user-friendly interface.

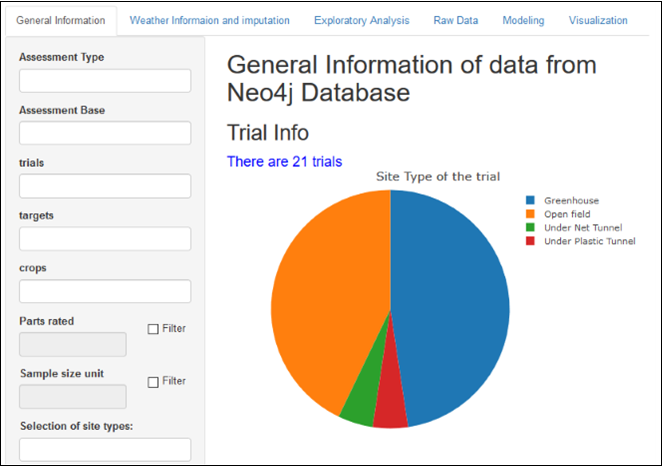
  • Interface Design: The user interface was built in R-shiny which is an interactive web application (app) straight from R. Through the web interface users can explore the data visually and produce graphical and statistical output for different use cases without writing a single line of code.
  • Data Extraction and Wrangling: As the raw data is stored in a structured way, the developed tool can fetch the needed data automatically, from connected relational database manage systems, a Neo4j knowledge graph and different web services. Data wrangling and merging in R was realized using packages like dplyr, tidyr and stringr.
  • Data Visualization: With the integration of a JavaScript library, the tool generates interactive maps showing the trial locations and related information, such as weather data, soil information and more meta data.
  • Statistical Modeling: Random forest and XGBoosting are used for the modeling. The user gets an overview of the model performance (R-square), the importance of different factors and influences of individual factors as well as the interaction strength between factors.

The developed tool was successfully implemented and will support product managers in their operational work. It provides an easy accessible overview of all trial information regarding a product and makes it possible to discover the most important factors for successful product applications and a high level of efficacy. The data is presented in interactive user-friendly dashboards.

Category

Technologies

R Shiny
Neo4j
Random Forest

Download

Social Sharing

Other Use Cases in this category