A field trial analysis pipeline: from query to dashboard
We built an end-to-end analysis pipeline for agricultural field trials: it pulls the data from connected databases on its own, consolidates it, trains models, and presents the result in interactive dashboards – operable by product managers with no technical background and without a line of code.

The situation
Every analysis project in field trial work repeats the same steps: extract raw data from a database, prepare it, visualise it, evaluate it statistically. Determining a product's efficacy from trial data and deriving application recommendations requires two people at once – someone with domain knowledge of the crop and the product, and someone who commands the data technically.
That is precisely the bottleneck. The business function cannot answer its own question but has to queue it. And because a large share of the steps is identical across all analyses, the same effort is expended again and again.
The data
Field trial data from several sources simultaneously: connected relational database systems such as SQLite, MySQL and PostgreSQL, a knowledge graph in Neo4j, and various web services.
The dataset to be analysed is not a fixed export but is assembled anew with each query – on the basis of filters the business function sets itself: assessment type, product components, individual trials, crops, timeframe. Added to that is site information such as weather and soil data.
Challenges
The tool chain, not the model. The greatest difficulty lay in connecting the various data processing tools into a working chain. That required knowledge of data storage, extraction, loading and analysis techniques at the same time – each link is manageable on its own; the chaining is the work.
The interface as a project risk. The tool was intended from the outset for users without a technical background. That makes usability a condition of success: a pipeline that computes correctly but cannot be operated without instruction will not be used. Documentation and intuitive guidance were therefore part of the core of development, not of its conclusion.
Approach
Automate extraction and preparation. The pipeline loads the required data on its own from the connected databases, the Neo4j graph and the web services, and consolidates it in the R backend. Preparation and merging with dplyr, tidyr and stringr; the resulting dataset can be downloaded as CSV for further use.
Make spatial context visible. Through a JavaScript library the tool generates interactive maps of the trial sites along with associated weather, soil and metadata. Zooming allows individual trials to be selected and examined in detail – with field trials, location is not incidental information but frequently the explanation for divergent results.
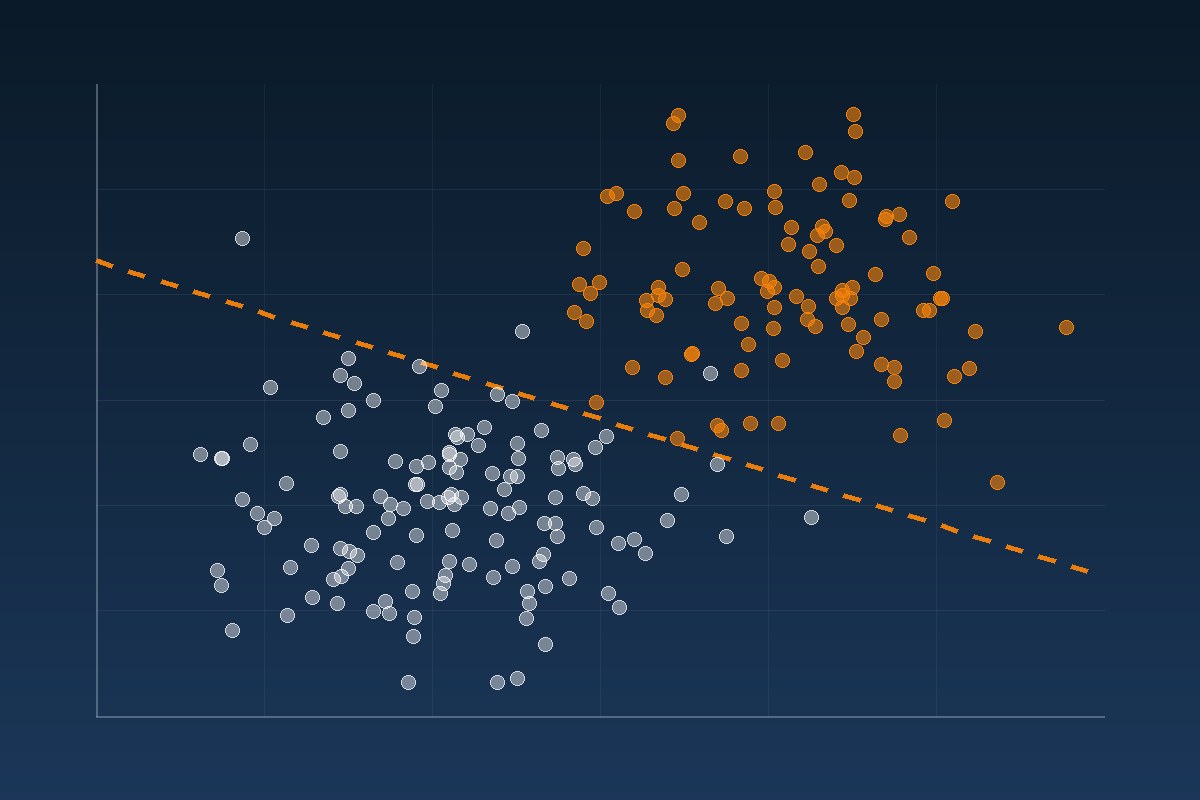
Model and break down the influences. Random forest and XGBoost are used for statistical modelling. The output is not only predictions but model performance via R², the importance of individual factors, the direction of their respective effects, and the strength of the interactions between them. That last point is the most interesting scientifically: which factors take effect only in combination?
Make results available from inside the application. Analysis runs in the web browser, and results can be saved as PDF or DOCX – so an analytical result reaches a decision paper without an intermediate step.
Outcome
The tool was successfully implemented and supports product managers in their operational work. It provides immediately accessible oversight of all study information for a product and surfaces the decisive factors for successful application and high efficacy. Presentation is through interactive dashboards, and the architecture allows further functions to be added as business requirements change, without disturbing the existing analysis.
The real effect, however, lies in the shift: analyses now happen where the questions arise, rather than in a queue with the data scientists.
Transferability
The pattern – opening up heterogeneous sources automatically, generating a dataset from filters, modelling, breaking down influences, making it operable for non-technical users – carries over wherever business functions need recurring analyses and the route through an analytics department is too slow. In pharmaceutical research that means the evaluation of assay series and preclinical studies.
Today
We would separate the architecture more strictly now. R Shiny remains a good choice for internal specialist applications, but data preparation and interface do not belong in the same application: the pipeline runs in an orchestrator such as Dagster, transformations in dbt, the query layer on DuckDB. For modelling, random forest and XGBoost remain right for trial data of this size, complemented by tabular foundation models for smaller trial series. Interactions between factors we now report through SHAP interaction values rather than built-in importance measures, which are biased when factors are correlated. Add reproducibility as infrastructure – containerised environments, pinned package versions, versioned datasets – and, alongside the filters, natural-language querying across the trial corpus.
Last updated: 30 July 2026