Classifying breast tumours: cost-sensitive thresholds
An internal methods study on publicly available datasets. We built models that classify breast tumours as benign or malignant from numerical cell features – and deliberately shifted the decision threshold so that a missed malignancy weighs more heavily than a false alarm.
The situation
Classifying tumour tissue relies on quantitative cell features that are ambiguous individually and only become informative in combination. That is a task for supervised learning – but one where accuracy alone is misleading.
Because the two possible errors are not worth the same. Classifying a benign finding as malignant causes an unnecessary follow-up. Classifying a malignant finding as benign can delay treatment. A model that treats both errors equally is unusable in this context, however high its accuracy.
The data
Two datasets from the Wisconsin hospital, with 570 and 700 cases.
Dataset 1 – cell-level features. Ten cell features per image, each recorded as mean, standard error, and a "worst" value, that is the mean of the three largest measurements.
Dataset 2 – cell attributes and mitosis stages. Individual values from one to ten per attribute, plus the mitosis stage.
Both datasets consisted of numerical features; image processing was not part of the project.
The challenge: in both datasets the distribution between benign and malignant cases was uneven. Under class imbalance, accuracy flatters – a model that simply predicts the majority class already scores highly. That was the reason not to stop the evaluation at accuracy.
Methods
Two supervised methods compared directly. With the target classes known, we used random forest and logistic regression: one capable with non-linear relationships, the other transparent and readily interpretable. Accuracy served as the common basis for comparing them.
Assess feature importance. Using the random forest we determined, for both datasets, which variables carry the prediction.
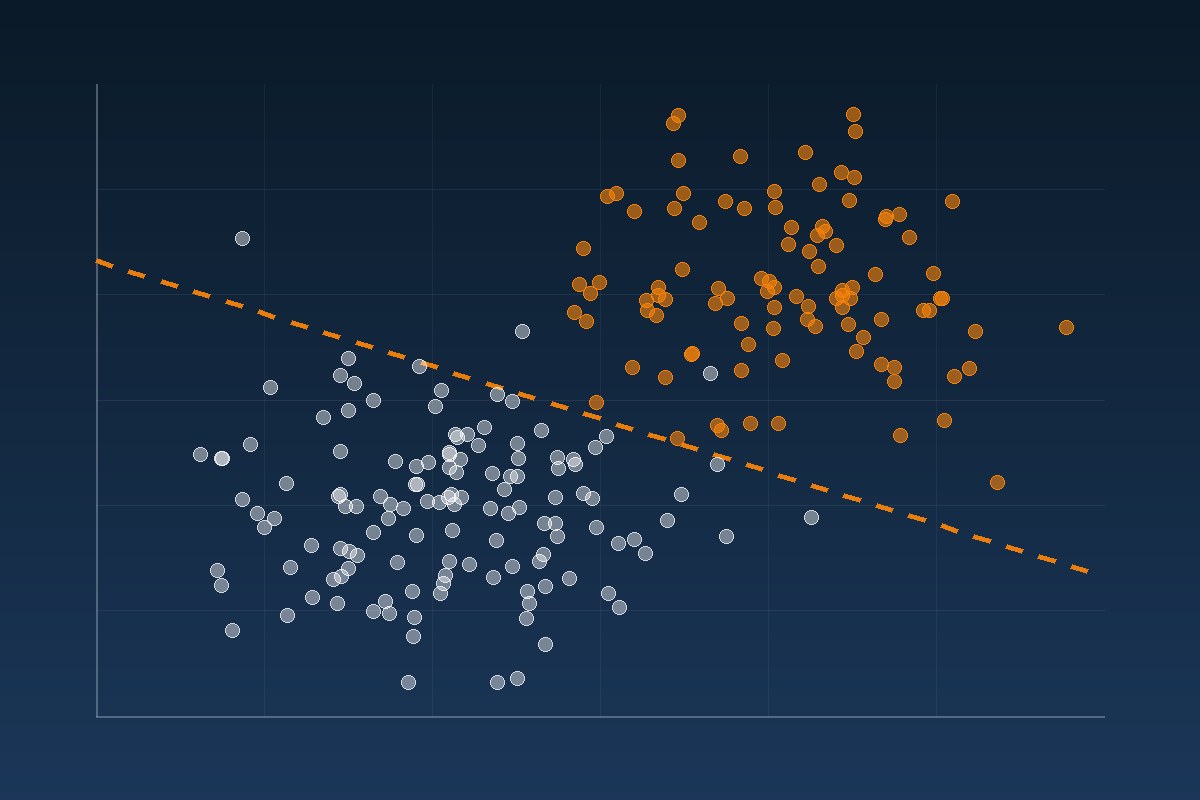
Set the decision threshold cost-sensitively. Confusion matrices were stored on the basis of an optimised F1 score. The threshold above which a prediction counts as positive was set to 0.475 and 0.25 – well below the default of 0.5. The model therefore leans towards classifying as malignant in doubtful cases, accepting false alarms in order to avoid missed malignancies.
Implemented in Dataiku. The workflow from data preparation through to model comparison remained documented and reproducible.
Outcome
Random forest: 99.7% and 99.3% accuracy. Logistic regression: 99.6% on both datasets. On these well-studied datasets such figures are to be expected – the two findings from the feature analysis are more interesting:
- In the first dataset the "worst" values were decisive, that is the means of the three largest measurements per feature. It is not a sample's average that carries the prediction but its extremes – which makes sense, since the most abnormal cells determine the classification.
- In the second dataset the mitosis stage played no role in the prediction. A notable result, because it denies relevance to a feature widely assumed to matter – and an example of why feature analysis belongs in such projects rather than being treated as an add-on.
To that add the effect of the threshold choice: because the two error types carry different weight, a threshold below 0.5 is not a degradation of the metric but a deliberate decision in favour of the clinically more expensive error.
Transferability
The setup – competing models, reported feature importance, a cost-sensitively chosen decision threshold, a documented workflow – is how we work in assay analysis, toxicity prediction and candidate prioritisation. Where the two possible errors cost different amounts, the threshold is the real domain decision, not the choice of model.
Today
For tabular data of this size the reference point has shifted: tabular foundation models such as TabPFN and its successors outperform classical gradient boosting on datasets up to a few tens of thousands of samples, and a few hundred to a few thousand cases in a medical context is their core segment. We keep a gradient boosting baseline as a control nonetheless, because these models' prior loses accuracy and calibration when missingness is high.
What has risen most is the standard of rigour: calibrated probabilities rather than bare classes, conformal prediction for per-case uncertainty intervals, SHAP instead of a random forest's built-in importance measures, which are biased when features are correlated, evaluation broken out by subgroup, and reporting to TRIPOD+AI. And classification from the outset: a model supporting diagnostic decisions falls under the IVDR and the high-risk requirements of the EU AI Act.
Last updated: 30 July 2026