A wind turbine register from satellite imagery: 3,300 turbines from 280,000 image tiles
How many wind turbines are there, where do they stand, and of which type? The question sounds trivial and is not – registers are patchy, outdated or spread across several authorities. In a proof of concept with Esri, a neural network processed 280,000 satellite image tiles and produced a register of around 3,300 wind turbines for North Rhine-Westphalia.
The situation
Anyone planning new areas for wind power needs the existing stock first: location and type of the turbines already in place determine setback rules, grid connection and local acceptance. If this foundation is missing or outdated, spatial planning becomes guesswork.
A comprehensive manual survey is not feasible at the size of a federal state, and it would be obsolete by the time it was finished: in the years 2016 and 2017 alone, around 300 new turbines were built in North Rhine-Westphalia. A survey therefore has to work not just once, but repeatably.
The data
Satellite imagery from the Esri World Imagery database: 280,000 individual image tiles, each covering one square kilometre, each with geographic metadata.
For training, 500 images were selected and 200 for validation – together covering roughly 200 wind turbines of different designs. The turbines were marked by hand in ArcGIS Pro as georeferenced polygons.
That ratio is the point of this project: a state-wide survey from 500 annotated images.
Challenges
Preprocessing and normalisation. Satellite tiles differ in capture time, sun position and image quality. Without normalisation, a model learns the capture conditions along with the object and fails in regions captured under different conditions.
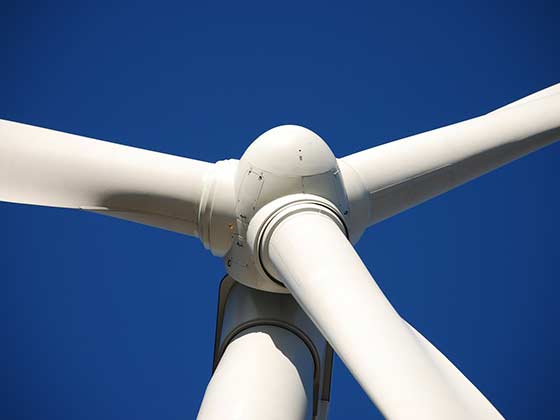
An object that is barely one from above. In a satellite image, a wind turbine appears as a slim tower with three rotor blades and a shadow whose length and direction depend on the time of day. That shadow is help and interference at once – it makes the turbine recognisable and at the same time changes its appearance from tile to tile.
The result has to be a register, not a list of hits. A detection rate is worthless if the result is not available as a geodataset that can be intersected with planning data.
Approach
Segmentation with a U-Net. A deep learning model based on the U-Net architecture was used for the task – a method that decides not only whether a turbine is in the image, but exactly where, delineated to the pixel.
Annotation and analysis in one environment. Marking the training polygons and the spatial analysis sit in ArcGIS Pro and its Python interface. That spares data exports between tools and keeps the georeference across the entire process.
Output as a layer, not a table. The result was captured as a layer in ArcGIS Pro – making it available in the form a planning authority actually works with.
Outcome
The result is a register of around 3,300 identified wind turbines for North Rhine-Westphalia, available as a georeferenced layer.
The approach transfers to other federal states without starting over: the image source is the same, the model is trained, and additional training data is only needed where landscape or turbine designs differ markedly. So the register is not the result – the result is a method that produces registers.
Transferability
Area-wide object detection from remote sensing data with georeferenced output carries far beyond wind power: photovoltaic systems, transmission towers, silos and halls, storage basins, transport infrastructure. The task is always the same – a stock that keeps changing is to be captured verifiably and repeatably. For photovoltaics we applied the same approach to orthophotos.
Today
The purpose has shifted, and that is the more interesting part. Wind turbines are now recorded in public registers – so the task is less often to find the stock and more often to check the register against reality and keep it current. A one-off survey becomes change detection over time series: what has been built since the last analysis, what dismantled? Technically, annotation effort has fallen further. Pretrained foundation models for remote sensing data can be adapted to a new object class with a few examples, and promptable segmentation models deliver object outlines without class-specific training. We would run processing over STAC-catalogued Cloud-Optimized GeoTIFFs instead of 280,000 individual tiles – which makes the difference between a federal state and a country.
Last updated: 6 August 2026