Explainable artificial intelligence for trial field analysis
a Supper & Supper Use Case

We focused on the interpretability of the feature importance, the marginal effect for the individual feature and the interaction effect between different features. In order to accomplish the task, the R package iml, lime and DALEX were employed.
- Feature importance: The first question from the product manager is “What factor has the strongest influence on the product?”. To answer this question, we measure the feature importance by calculating the increase in the model’s prediction error after permuting the feature.
- Marginal effect: Accumulated Local Effects (ALE) are used for describing the marginal effect, which is the relationship between the target variable and the feature.
- Interaction effect: The left heatmap shows the interaction effect (second order effect) of two variables — so how is the effect of one variable on the target influenced by another one. The right heatmap shows the total effect (interaction effect + individual main effect) of two variables, which gives information about which combination of factor levels lead to good or bad agricultural performance. By putting these two heatmaps together, the user can identify the high-interacted region and the effect scale between interaction and main effect.

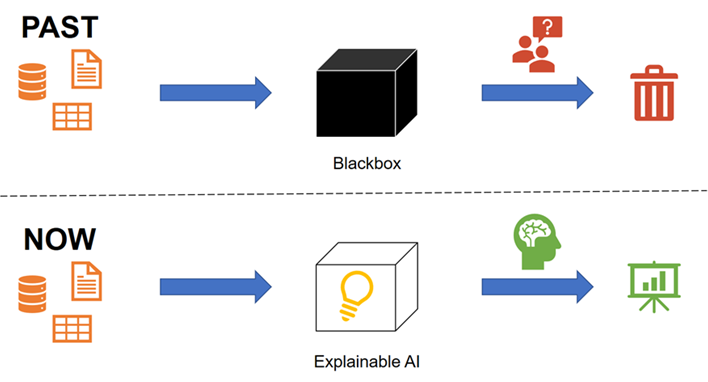
We successfully developed an analysis process for AI model explanation. This process can be applied in various machine learning models such as XGBoosting, random forest, linear model and logistic regression. The explanation is intuitive, easy to understand and the graph can provide further insights from the model. The product manager can make decisions or modify the business strategy based on the gained insights.
Other Use Cases in this category
Explainable artificial intelligence for trial field analysis a Use Case lesen

Automated and user-friendly Data Analysis Pipeline for Agricultural Field Trials Use Case lesen

Crowd Control - Using AI to track people counts Use Case lesen

